TrustRadius
Qlik Sense

Qlik Sense

Overview

What is Qlik Sense?

Qlik Sense® is a self-service BI platform for data discovery and visualization. It supports a full range of analytics use cases—data governance, pixel-perfect reporting, and collaboration. Its Associative Engine indexes and connects relationships between data points for creating actionable insights.

Read more
Recent Reviews

TrustRadius Insights

Qlik Sense, a widely used data visualization and management tool, has proven to be invaluable for organizations in various industries. …
Continue reading

Qlik Sense makes sense

9 out of 10
November 25, 2022
Incentivized
Qlik Sense itself is quite easy to implement to support BI activities in the organization. We develop Qlik apps in a mixed-mode. Something …
Continue reading

10/10 recommend!

8 out of 10
November 19, 2022
Incentivized
We deal with a lot of data to manage student experiences and numbers which can be overwhelming to manage especially for new hires, Qlik …
Continue reading
Read all reviews

Awards

Products that are considered exceptional by their customers based on a variety of criteria win TrustRadius awards. Learn more about the types of TrustRadius awards to make the best purchase decision. More about TrustRadius Awards

Popular Features

View all 28 features
  • Customizable dashboards (310)
    8.9
    89%
  • Drill-down analysis (319)
    8.8
    88%
  • Pre-built visualization formats (heatmaps, scatter plots etc.) (304)
    8.4
    84%
  • Formatting capabilities (312)
    8.2
    82%

Video Reviews

2 videos

Qlik Review: How Qlik Sense Opened the Door for this Business Analytics Manager
02:26
Qlik Review: Qlik Sense Houses Business Data In One Place For Easy Analytics Discovery
02:43
Return to navigation

Pricing

View all pricing

Standard

$20

Cloud
per month per user (10 user minimum)

Premium

$2700

Cloud
per month unlimited basic users & purchased full users

Qlik Sense Enterprise on Windows

Contact Sales

On Premise

Entry-level set up fee?

  • No setup fee
For the latest information on pricing, visithttps://www.qlik.com/us/pricing

Offerings

  • Free Trial
  • Free/Freemium Version
  • Premium Consulting/Integration Services

Starting price (does not include set up fee)

  • $20 per month per user (10 user minimum)
Return to navigation

Product Demos

Qlik Sense ESRI Extension Demo

YouTube

Tableau VS Qlik Sense VS Power BI : (EP 1) - Performance: loading ~40 million records

YouTube

Integrate Maps in Qlik Sense: GeoQlik for Qlik Sense demo (English language)

YouTube

QLIK Sense OEM Integration.qlik.com - Concept behind the demo platform

YouTube

Demo Tableros de Control con QlikSense

YouTube

Crea una Aplicación con Qlik Sense desde Excel

YouTube
Return to navigation

Features

BI Standard Reporting

Standard reporting means pre-built or canned reports available to users without having to create them.

8.4
Avg 8.2

Ad-hoc Reporting

Ad-Hoc Reports are reports built by the user to meet highly specific requirements.

8.6
Avg 8.1

Report Output and Scheduling

Ability to schedule and manager report output.

8.7
Avg 8.4

Data Discovery and Visualization

Data Discovery and Visualization is the analysis of multiple data sources in a search for patterns and outliers and the ability to represent the data visually.

8.6
Avg 8.1

Access Control and Security

Access control means being able to determine who has access to which data.

8.9
Avg 8.6

Mobile Capabilities

Support for mobile devices like smartphones and tablets.

7.5
Avg 8.0

Application Program Interfaces (APIs) / Embedding

APIs are a set of routines, protocols, and tools for used for embedding one application in another

8.5
Avg 7.9
Return to navigation

Product Details

What is Qlik Sense?

Qlik Sense is a business intelligence (BI) and visual analytics platform that supports a range of analytic use cases. Built on Qlik’s Associative Engine, it supports a full range of users and use-cases across the life-cycle from data to insight – with self-service analytics, interactive dashboards, conversational analytics, custom and embedded analytics, mobile analytics, and reporting. The solution comes in three different editions - Qlik Sense Enterprise, Business, and Team. Qlik Sense can be deployed in the cloud or on-premises.

The Qlik Sense analytics platforms aims to empower everyone in organizations to make data-driven decisions. People of all skill levels get analytical power, with associative exploration and search, AI-powered insight suggestions, AI-accelerated creation and data prep, advanced analytics integration, and natural-language, conversational interaction. They can share and communicate the insights they discover and get answers anywhere they work – with interactive and secure online and offline mobility. And for the enterprise, users get a platform with open and standard APIs for customization and extension, data integration and connectivity, centralized management and governance, and a Kubernetes based SaaS / multi-cloud architecture driving scalability across combinations of on-premise, private, and public cloud environments.

Qlik Sense Features

BI Platform Features

  • Supported: Administration via Windows App
  • Supported: Administration via MacOS App
  • Supported: Administration via Web Interface
  • Supported: Live Connection to External Data
  • Supported: Snapshot of External Data
  • Supported: In-memory data model
  • Supported: OLAP (Pre-processed cube representation)
  • Supported: ROLAP (SQL-layer querying)
  • Supported: Multi-Data Source Reporting (Blending)
  • Supported: Data warehouse / dictionary layer
  • Supported: ETL Capability
  • Supported: ETL Scheduler

Supported Data Sources Features

  • Supported: MS Excel Workbooks
  • Supported: Text Files (CSV, etc)
  • Supported: Oracle
  • Supported: MS SQL Server
  • Supported: IBM DB2
  • Supported: Postgres
  • Supported: MySQL
  • Supported: ODBC
  • Supported: Cloudera Hadoop
  • Supported: Hortonworks Hadoop
  • Supported: EMC Greenplum
  • Supported: IBM Netezza
  • Supported: HP Vertica
  • Supported: ParAccel
  • Supported: SAP Hana
  • Supported: Teradata
  • Supported: Sage 500
  • Supported: Salesforce
  • Supported: SAP
  • Supported: Google Analytics

BI Standard Reporting Features

  • Supported: Pixel Perfect reports
  • Supported: Customizable dashboards
  • Supported: Report Formatting Templates

Ad-hoc Reporting Features

  • Supported: Drill-down analysis
  • Supported: Formatting capabilities
  • Supported: Integration with R or other statistical packages
  • Supported: Report sharing and collaboration

Report Output and Scheduling Features

  • Supported: Publish to Web
  • Supported: Publish to PDF
  • Supported: Output Raw Supporting Data
  • Supported: Report Versioning
  • Supported: Report Delivery Scheduling
  • Supported: Delivery to Remote Servers

Data Discovery and Visualization Features

  • Supported: Pre-built visualization formats (heatmaps, scatter plots etc.)
  • Supported: Location Analytics / Geographic Visualization
  • Supported: Predictive Analytics
  • Supported: Support for Machine Learning models
  • Supported: Pattern Recognition and Data Mining

Access Control and Security Features

  • Supported: Multi-User Support (named login)
  • Supported: Role-Based Security Model
  • Supported: Multiple Access Permission Levels (Create, Read, Delete)
  • Supported: Report-Level Access Control
  • Supported: Table-Level Access Control (BI-layer)
  • Supported: Field-Level Access Control (BI-layer)
  • Supported: Single Sign-On (SSO)

Mobile Capabilities Features

  • Supported: Responsive Design for Web Access
  • Supported: Mobile Application
  • Supported: Dashboard / Report / Visualization Interactivity on Mobile

Application Program Interfaces (APIs) / Embedding Features

  • Supported: REST API
  • Supported: Javascript API
  • Supported: iFrames
  • Supported: Java API
  • Supported: Themeable User Interface (UI)
  • Supported: Customizable Platform (Open Source)

Additional Features

  • Supported: In memory data indexing Associative Engine
  • Supported: Machine Learning with the Qlik Cognitive Engine
  • Supported: Augmented Intelligence and insight suggestions with Insight Advisor
  • Supported: Conversational Analytics with Qlik Insight Bot
  • Supported: Open APIs, in addition to Qlik Analytics Platform
  • Supported: Multi Cloud Architecture with docker containers deployed and orchestrated within Kubernetes
  • Supported: Data Catalog & Data Ops Management with Qlik Data Catalyst
  • Supported: Public and syndicated data as a service with Qlik Data Market
  • Supported: Qlik Associative Big Data Index delivers Qlik’s associative experience on top of Big Data
  • Supported: Flexible deployment options including Enterprise SaaS and combination of cloud and on-premise options
  • Supported: Enterprise reporting and distribution with Qlik NPrinting
  • Supported: Advanced geopolitical calculation and geotagging with Qlik Geo Analytics
  • Supported: Embedded analytic capabilities to build, extend and deploy custom solutions that are scalable and cloud-ready with Qlik Core

Qlik Sense Screenshots

Screenshot of Qlik Sense Cash Flow DashboardScreenshot of Qlik Sense Global Smart SearchScreenshot of Qlik Sense Smart Data Compression - Get immediate insight on large dataScreenshot of Extend, mix and mash-up with our APIsScreenshot of Add "External data" with Qlik DataMarket - Data as a ServiceScreenshot of Visualization BundleScreenshot of Help Desk case analysisScreenshot of Concentration analysisScreenshot of KPI DashboardScreenshot of Geographical Accident Analysis

Qlik Sense Videos

Qlik Sense Integrations

Qlik Sense Competitors

Qlik Sense Technical Details

Deployment TypesOn-premise, Software as a Service (SaaS), Cloud, or Web-Based
Operating SystemsWindows, Linux, Mac, Kubernetes
Mobile ApplicationApple iOS, Android, Windows Phone, Blackberry, Mobile Web
Supported CountriesAmericas, EMEA, LATAM, APAC
Supported LanguagesThe Qlik Management Console is English only.    The Qlik Sense client supports the following languages: English, German, Spanish, French, Italian, Japanese, Dutch, Brazilian Portuguese, Russian, Swedish, simplified Chinese, Polish, Turkish, Korean, and Traditional Chinese.   The language Qlik Sense uses depends on the language preferences of your browser. The default reading order in a Qlik Sense app is left to right. You can change the reading order to right-to-left in your app preferences if your data or labels are in a right-to-left language such as Arabic or Hebrew.

Qlik Sense Downloadables

Frequently Asked Questions

Qlik Sense® is a self-service BI platform for data discovery and visualization. It supports a full range of analytics use cases—data governance, pixel-perfect reporting, and collaboration. Its Associative Engine indexes and connects relationships between data points for creating actionable insights.

Qlik Sense starts at $20.

Microsoft Power BI and Spotfire are common alternatives for Qlik Sense.

Reviewers rate Multi-User Support (named login) highest, with a score of 9.2.

The most common users of Qlik Sense are from Enterprises (1,001+ employees).
Return to navigation

Comparisons

View all alternatives
Return to navigation

Reviews and Ratings

(995)

Community Insights

TrustRadius Insights are summaries of user sentiment data from TrustRadius reviews and, when necessary, 3rd-party data sources. Have feedback on this content? Let us know!

Qlik Sense, a widely used data visualization and management tool, has proven to be invaluable for organizations in various industries. Users have praised its ability to provide consistent and visually appealing information, ensuring that everyone within the organization is on the same page when it comes to business performance. By reducing the manual workload of repetitive reporting tasks, Qlik Sense allows users to transition to more strategic business intelligence practices. This makes it a go-to BI tool for different departments and functions across the organization.

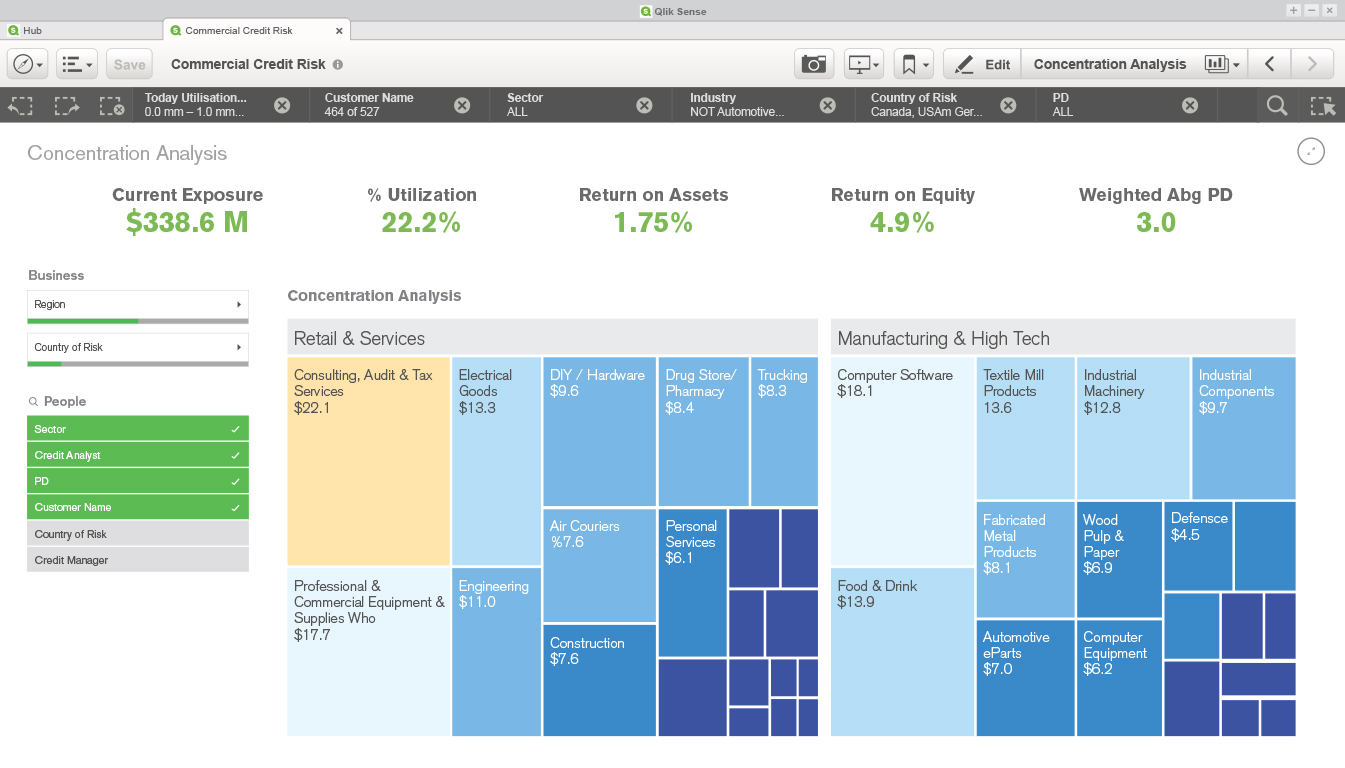
One of the standout features of Qlik Sense is its efficiency in processing large volumes of data and its flexibility in combining data from multiple sources. This enables users to create simple yet powerful dashboards that track impact and outcomes, financial performance, and cost modeling data analysis. Not only does Qlik Sense address reporting needs, but it also provides valuable insights that can inform decision-making processes. It has become an indispensable enterprise reporting tool, supporting management reporting and facilitating data exploration.

From inventory tracking and forecast analysis to providing executives with a quick overview of the company's health, Qlik Sense proves its versatility across various use cases. Its self-service business intelligence capabilities allow users to create personalized dashboards and analyze complex datasets without relying on technical expertise. By improving decision-making processes and saving time for users, Qlik Sense has established itself as a trusted companion in the realm of data visualization and analysis.

Users have made several recommendations based on their experiences with Qlik Sense. The three most common recommendations are as follows:

  1. Conduct thorough research before selecting Qlik Sense: Many users suggest exploring other tools in the market and comparing them with Qlik Sense. They recommend conducting research to ensure that Qlik Sense aligns with specific business requirements and needs.

  2. Take advantage of available resources and demos: Users recommend taking advantage of the free trial and demo apps provided by Qlik. They suggest testing the ease of use and functionality of Qlik Sense before making a decision. Additionally, users recommend exploring resources such as Qlik Branch or GitHub for extensions and add-ons to enhance the capabilities of Qlik Sense.

  3. Understand business processes and define requirements: It is recommended to have a clear understanding of the business processes and requirements before selecting any BI software, including Qlik Sense. Users emphasize the importance of defining evaluation criteria and having a list of requirements handy during the evaluation process.

Overall, users believe that Qlik Sense offers a robust BI platform with extensive capabilities, particularly suitable for large business setups in industries such as retail and manufacturing. Users appreciate its interactive visualization options, excellent data integration, adaptability to multiple devices, and ability to analyze data from various sources quickly. They also suggest investing in training and ensuring thorough knowledge of all features before attempting complex tasks.

Attribute Ratings

Reviews

(1-25 of 65)
Companies can't remove reviews or game the system. Here's why
November 25, 2022

Qlik Sense makes sense

Score 9 out of 10
Vetted Review
Verified User
Incentivized
Qlik Sense itself is quite easy to implement to support BI activities in the organization. We develop Qlik apps in a mixed-mode. Something we do in-house, but for bigger tasks we ask a partner to help. Each app covers its own company area or process to support managers and their teams. It's quite important to think about actual needs when you decide to develop a new one. Deep analysis of current information and forecasting almost always provides more value to the company than analyzing historical data. Try to focus on that and Qlik should help.
  • Easy to start
  • Easy to use
  • Fast and agile
  • Experts are needed to implement and use it in a right way.
  • Less benefits without trained users.
Based on experience and comparison with other solutions.
November 05, 2022

One Qlik is all it takes

Anjum Arora | TrustRadius Reviewer
Score 8 out of 10
Vetted Review
Verified User
Incentivized
The goal of using Qlik Sense in our organization is to make the organizational data easily accessible, reliable, consistent and secured to support and improve business planning, decision making processes and measure strategic KPIs of business in real-time.Qlik Sense is leveraged for development and use of Management and Functional Metrics and Dashboards to measure our KPIs and progress towards strategic goals. These metrics are agreed upon in advance and endorsed by senior leadership.

For example -

Sales Module: Country Sales Performance, Growth analysis, Sales Performance, Sales by business segment, Regions/Country/area, Sales by product brand, Sales by new product, Salesman performance, Intercompany sale and purchase by product, Margin analysis, etc.

Finance Module: Account receivable and collection, Profit and Loss, Cash flow, Financial key ratio, Credit note control, OPEX analysis, OPEX by function, Functional report, Management report, Investment Report, etc.

Inventory and Stock Module: Inventory listing, Stock movement at country level, Inventory aging etc.

SOM Module: Inventory, Budget-Forecast-Actual Sales in each country, OPEX Analysis, Logistics etc.
  • Self-Service Visualization and Discovery
  • Fullstack BI from ETL to Visualization, its built-in ETL engine can transform disparate data sets into a common data structure
  • Uses HTML5 based responsive design which visualization automatically adapt to the screen size and orientation of the users device
  • Actively engaged community and resources to help you learn this software in the best possible manner
  • Scalability is RAM limited, all data is associative and in-memory so server's RAM is directly proportional to performance
  • Limitation on advanced analytics capabilities in the form of R integration to perform complex statistical and analytical calculations
  • Can have more intuitive interface
Qlik Sense provides very effective unified view of our data and extensibility. It offers the most interactive visualization and visual drill-down, responsive/adaptive to different screen sizes and form factors, and having built-in ETL engine to transform disparate data sets into a common data structure. Qlik Sense platform provides a greater level of self-service data discovery but in a controlled form, nominated power users have the ability to create charts and tables and publish to the main applications.

Qlik Sense's has limitation on advanced analytics capabilities in the form of R integration to perform complex statistical and analytical calculations
September 19, 2022

Qlik Sense, a great product

Jeanine Willig | TrustRadius Reviewer
Score 8 out of 10
Vetted Review
Verified User
Incentivized
I work with hard-to-use databases that produce large sets of data. In order for the data to translate into useful information, I use Qlik Sense to create comprehensive visualizations to give senior leaders and managers the ability to understand their current workforce composition and plan for the future.
  • Color
  • third party apps
  • linking data sets
  • relatively easy for a new user in a low-code environment to adopt
  • need to export images better
  • better Microsoft integrations
  • more options for intuitive app navigation
Great for large data sets, regularly updated data, and survey analysis. don't use it for static data, small data sets, or a one-time report.
Richard Stables | TrustRadius Reviewer
Score 8 out of 10
Vetted Review
Verified User
Incentivized
We accumulate data concerning our service provision via a system that stores data in a Postgresql DB. We use Qlik Sense to aggregate and analyse the data to establish metrics and track outcomes for our services. We use analytics to create a wide range of measures and annual outcomes generation, and ad hoc queries.
  • Flexible data visualisations
  • Easy to manipulate to provide for alternative scenario modeling
  • Good for exporting query results eg to Excel for further analysis
  • I would like to see the authentication for access to the software improve (to be more flexible)
  • It would be good sometimes to get more context-sensitive hints and tips to do with data modeling
  • Better tuition on good practice use of the software for non DB specialists
You have large amounts of data, and understanding trends and aspects of that is critical to being able to monitor and improve your organisation's performance. Qlik Sense is ideal for this. You can create easy-to-understand visualisations, which identify issues ("actionable insights") or act as useful aids to business decision-making. For small datasets, held locally, you might find the investment in learning is not necessary if something like Excel or another tool can do the job.
Angel Monjarás | TrustRadius Reviewer
Score 10 out of 10
Vetted Review
Verified User
Incentivized
We use it to track the sales and profitability of our retail beverage startup business. Some special use cases arise from time to time such as reporting on the status of large customer orders.
  • Available for all users and developers without installation.
  • Easy to set up and follow alerts.
  • Combine multiple sources of data.
  • Easily program automatic actions.
  • Include a "dark mode", especially for developers. Sometimes the white screen is too tiresome on the eyes.
  • A simpler way to connect to on-premise ODBC sources.
The SaaS version is super easy to use and very intuitive. The associative engine means you don't have to rely on a single data table or resort to SQL-type joins. It just works! The assistant mode will pick the best visualization for you, but you are still in control if you want.
Score 7 out of 10
Vetted Review
Verified User
Incentivized
Qlik is used to push reports out to line areas in an easy to use way. The usage of reports differs across business areas, with some preferring to take visualisations at face value, and others preferring to use filters to export relevant data. Specialised data areas are required to build the reports from SQL tables.

As a sweeping generalisation, I would characterise contract managers as the biggest users of the visualisation. Program managers will check the reports for accurate data, and will export the data for compliance and pattern checking.
  • Some of the visualisations are very convincing. I have particularly enjoyed plotting on maps.
  • Very easy to export data with filters.
  • Easy for anyone to build a report from a variety of sources.
  • I have not been able to publish a report just for my team (publishes only to a wider audience). This has limited its usage in my current role due to sensitive data.
  • Some of the coding language can be very confusing, requiring un-intuitive approaches to solve conditional problems (it has been a while since I have coded).
  • I would appreciate the ability to roll back to previous versions more easily - having multiple backups can be a hassle.
Well suited when you need a report to go out to many different types of users with varying levels of data skills.

Well suited when you need to guide users to places they need to look at.

Not well suited as an initial place to explore your data, prior to building a report.
November 20, 2021

Getting Closer

Score 4 out of 10
Vetted Review
Verified User
Incentivized
We were and are, still, heavy QlikView users. While QlikSense is making great strides, it has not caught up with the features that our users have come to love and expect from our guided analytics products.
  • Visuals
  • Responsive Design
  • Web authoring
  • Layering
  • Custom visual control
  • Large amounts of data on screen
If you are new to analytics and not spoiled by what QlikView can offer, it's a fabulous choice. It is so much nicer and more modern. It just lacks some key features.
Score 10 out of 10
Vetted Review
Verified User
Incentivized
Qlik Sense is used by our company for management dashboards of company performance, for analyzing sales and financials of the company, and for reviewing market data, among other things.
  • Provide quick informative views of company performance and activity
  • Highlight outlying accounts, commodities and transactions
  • Allowing drill down into details behind these items
  • Integrating multiple data sources
  • Exporting to both PDF and Excel could be improved in terms of formatting and control over what information is included
  • Analyzer capacity minutes are expended even if a user is idle, users have to remember to close the app
We use Qlik Sense to create dashboards of customer accounts, commodities, suppliers, account managers, and salespeople, etc., with the ability to drill into the details of any outlying figures. We also use it to analyze large amounts of market data and monitor user activity.
Score 8 out of 10
Vetted Review
Verified User
Incentivized
Very robust and user friendly. Strong tools for data analysis. Helpful in data democratization with tools like data catelog. Will is able to handle large amount of data with out any processing lag. Even complex data models with require heavy calculations are handled quickly by Qlik. The learning curve for new users is not steap.
  • Large data processing.
  • Easily build data models.
  • Excellent visualization tools.
  • User friendly.
  • Better AI assistant.
  • Version control.
When you need to process and visualize large amount of data from multiple data sources, Qlik is the best in business. User friendly and easy to integrate, this helps when your team may not the the most technically sophisticated. Qlik helps the orgay to become more data driven which helps effective decision making.
Score 8 out of 10
Vetted Review
Verified User
Incentivized
Our whole company uses Qlik Sense. We are a very data-driven company, and Qlik Sense gives us a great tool to look at data and visualize and analyze data in different ways. An example is Sales where we drill down on Product and Color level to see what Brand and Products perform during each season.
  • Data visualization.
  • Access to aggregated data.
  • Version handling of scripts.
  • Integrations to 3rd party systems in and out.
Qlik Sense is very good when businesses need to get lots of data for various sources and to quickly adjust the data presented. It can also act as an in-time analyzer for quick Proof of concept studies. When we have business teams working in dedicated applications, then it's better to have reporting directing in that application, so users don't need to open a second app(Qlik), instead, they use only 1 app.
Score 9 out of 10
Vetted Review
Verified User
Incentivized
It is being used across the whole company. I primarily use it to develop risk monitoring dashboards used to help identify and mitigate risks within our division. We also use it to track partner volume and performance. Another benefit provided our Relationship Managers the ability to rind potential opportunities for new partnerships.
  • Allows you to create your own data models.
  • Customizing the loading of data to fit your specific need.
  • Plenty of objects to work with.
  • More control over headings, titles, and column labels. Font size, boldness, and color.
  • Ability to set an object to specific size.
  • Allow for copying of measures for similar columns with minor changes.
It is great at linking disparate data sources to create a data model specific to the dashboard you are building. The ability to customize the loading process through the script editor allows you to transform the data, build reference tables, and create calculated fields to meet your needs. I would like to see the ability to add reference lines to scatter plots added. Not just for the X or Y axis bot for the relationship of X and Y. Allowing you to identify dimensions above and below the expected performance level.
Score 9 out of 10
Vetted Review
Verified User
Incentivized
Qlik Sense is being used at our organization as a single self-service business intelligence and reporting solution across all our geographical locations worldwide. Users in each department are served with both standard and customized analytical solutions that are published to their individual streams. Ad-hoc reports are churned out using the NPrinting ad-on of Qlik Sense. Our business analytics and reporting team manage the entire multi-server enterprise Qlik Sense environment from a central location.

Most of our business problems were the availability of accurate data and speedy access to standard reports. Qlik Sense has helped achieve these goals.
  • Intuitive and easy to use dashboards.
  • Pixel perfect reports.
  • Scalable analytics.
  • Centralized management of user access.
  • Advanced analytical features require third party extensions.
  • Building own extensions is not easy.
  • Multi-developer environment is not well supported.
  • Version control is missing.
Qlik Sense offers an end-to-end solution that scales well. I would advise any organization whether small or large to give it a try. The delivery of output is browser-based and so is the development. This makes its platform independent as far as users are concerned, and the result is a seamless and scalable solution. Also advantageous is the ability to develop, control, and maintain from the stage of data ingestion up to the front end. To those companies where one is expected to build their own dashboards on the go, Qlik Sense can have a steep learning curve.
Score 8 out of 10
Vetted Review
Verified User
Incentivized
Qlik Sense is used across the whole organization to help our manufacturing plants to collect and access data easily and quickly. It also helps automatize a lot of excel reports and save time for people in order to analyze data instead of just preparing it. We now use it for our safety, Quality, Logistic, Production, Sales, Human resources KPIs. This system is a huge help in terms of centralizing a lot of information in a common place.
  • Qlik Sense is very user-friendly and does not request strong coding knowledge. A non-IT person can easily take control and manage this platform with some training. Only SQL basics are enough to start. Plus the drag and drop system to create charts is very intuitive.
  • The Qlik community is huge and when we have a problem that we can't solve it is usually very simple to find the solution online. Plus they have a training program and documentation online which is very helpful and useful.
  • This system allows you to set up your own ETL process and data warehouse if you do not have too much data to handle. The QVD files which are specific to Qlik Sense are very easy to understand and convenient to use.
  • More charts and visuals would be a plus. Also, some objects do not have enough options to color the way we want (filter / button / combo chart for example).
  • Adding the option to have a box text when we hover an object would be great as well.
  • A write-back function integrated into the platform would be a plus. Some company proposes an extension that we have to pay, but if Qlik could offer this for free it would be a great plus.
  • Maybe in the future adding some algorithm and statistics to allow to do some predictive analytic would be a huge plus.
Qlik Sense is great for simple set databases analysis. Data which are stored in SQL database and well organized or directly in some excel files. The system allows us to read and cross information in a very easy way which allows the discovery of good insight. Where the system is not the best is if you need to access live data and display changes that occur every minute.
August 02, 2021

JollyRoger2021

Score 10 out of 10
Vetted Review
Verified User
Incentivized
QlikSense is being used by the network planning community to visualise data formed from various primary data sources of inventory and customer information to formulate decision making on growth and future investment. It is used to monitor and provide a window for planners to view possible "network at risk" issues or demand changes that require short term remedial action. It solves many of the issues of establishing a single source of truth, that planners can rely on. The volume of data that is processed daily/weekly/monthly makes heavy use of pre-processing and date dependent versions of data allowing comparison of versions.
  • Out of the box [makes it] easy for Excel / Access user to get started
  • Visual interface easy to use from novice to expert
  • The flexibility to perform data ingestion and pre-processing into QVDs
  • In organisation with a large number of teams and apps, a better front end category based or hierarchy based menu to find and execute the app.
  • More flexible tiling on the app selection to scale tab cascade roll through etc.
  • Data column selection could be improved to allow table, field drop view / expansion
When you have large data sets from multiple sources and you need to apply screening, interpret and add filtering/category fields then view you data from macro to micro detail, then Qlik Sense is the tool you need. The distribution of the application to non Qlik Sense licensed end viewers can be an issue if you need to rapidly expand especially in an organisation that is adopting Agile at scale, with flexible and fluid work groups.
Score 10 out of 10
Vetted Review
Verified User
Incentivized
Qlik Sense Enterprise is used by two divisions of our corporation and is used by the majority of the departments within those organizational entities and in a very self-empowered way.
We have other business intelligence applications (from other vendors) as well that allow MS Excel Add-in functionality to review enterprise performance results, but for visualizations and dashboards, we selected Qlik Sense as the preferred tool in that domain.
We segregate the creation of enterprise quality transactional system sources of data so that the QVD files (i.e. data warehouse) is one layer managed by IT Support staff (including myself) but once the datasets of the correct data quality are made available as QVD files then the business staff in any of the departments has the access to build visualizations and dashboards from the data contained in those files in any way they see fit (including the blending of datasets as appropriate with either other enterprise-quality data or with their own spreadsheets).
  • Qlik Sense reports the data from the QVD files really well so the end-user experience is always optimum. Hardly any wait time is ever noticed at all which is magnificent compared to some other products in this space.
  • The fact that Qlik Sense is also already fully mobile device-ready is a big bonus. Other applications have to have different variations either declared upfront or at least tested but Qlik Sense works really well whether via the designated proprietary Qlik Sense Mobile App (from the App store) or just in a standard browser like Safari.
  • Data ingestion times are really optimum too since millions of records can be added to a QVD file in only a few minutes. This helps our organization with optimizing the overnight loading window.
  • The background loading tasks scheduling is also user-friendly and robust with good error logging and failure/success monitoring available.
  • We use SAP for transactions and SAP BI for data warehousing so it is very useful to also use Qlik Sense along with the proprietary Qlik Sense SAP Connector so that data can be retrieved as datasets from BW Query results. This helps leverage all our investment in the BW modeling including the full SAP BW query catalog when ingesting data into the QVD files. At the same time, the SQL connector can retrieve data from our SAP HANA database with ease too.
  • The ability to develop on the iPad is also a bonus that is often not available in other tools in this domain.
  • The security modeling is relatively easy to maintain and integrates well with our Azure identity management system. This all makes user management tasks very seamless and robust, ensuring that only those that really need access to the Qlik Sense system are granted hat access and if they leave their access is quickly revoked.
  • The PDF printing of dashboards is part of a secondary product called NPrinting and we did not choose to additionally purchase this product. This means that broadcasting the results of a dashboard (in the enterprise on-premise product) is not really available to us, but I guess that was the trade-off. It would be great if that functionality was at some point built into the design/licensing of the main Qlik Sense Enterprise product.
  • The fact that all loading is via proprietary syntax scripting is a little cumbersome and has a reasonably high learning curve. SQL is the standard and while some SQL statements can be used in the data ingestion process it is also then the mix of two syntaxes in one script.
  • Some of the design concepts (such as table concatenation) in the scripting syntax are a little non-intuitive. I prefer to not have things happening in an automated way (others may disagree since it means less coding rather than more) but it just adds to the learning curve when things are automatically occurring in the background (which might come as unexpected outcomes to a developer that is new to the Qlik Sense product).
The Qlik Sense system is really well suited to all businesses of varying sizes and to all user types (i.e. basic, power user, advanced user, and consultant). Data is an asset to any business, so to use Qlik Sense to leverage that asset and to have a robust and user-friendly environment to develop new analytics artifacts in is a real bonus.
Basically, if you can afford the product then it is probably worth taking a good look at whether it is a best-practice product that you want to opt for. Perhaps the Cloud-hosted option is the best one to go for since that is the way of the future and a lot of new functionality is released on the Enterprise Cloud edition first. Also, that way you are not looking at the hosting costs and server management such as version upgrades in the same way.
Score 10 out of 10
Vetted Review
Verified User
Incentivized
Qlik Sense is used primarily by our Delivery and Testing Services teams to track and manage customer health, margin analysis, a view of bugs over time, and project progress. We are currently rolling out more functionality to the sales and sales support teams to better track territory coverage, manage prospecting activities, and whitespace analysis.
  • Data modeling
  • Visualizations and pivots.
  • Connecting to and combining multiple data sources.
  • Ability to better control use of colors and fonts within table headers.
  • Creating better looking visualizations.
  • Ability to have end users reload an app without giving them powerful permissions.
Qlik sense is well suited to working with large quantities of data from many sources. It is also capable of doing small stuff like balance sheets and sales pivots, but the real power comes from working with large data sets. Qlik has the ability to concatenate many data sets into a single fact table that allows all measurable data to be shown on the same screen in the front end. That is a huge differentiator for Qlik vs the other BI vendors.

One area where Qlik falls short is in the presentation of the data. The tables, charts, and graphs and don't look as good as some of the other tools due to a lack of formatting controls. To combat that, we purchased the VizLib add-on and that allows Qlik to shine on both the front and back ends.
July 09, 2021

Qlik Sense Review

Score 9 out of 10
Vetted Review
Verified User
Incentivized
Qlik Sense is being used across [the] department and across [the] company. We have implemented Qlik view before.
The problem we face when implementing Qlik Sense compared to Qlik View is sometimes with the display on mobile is too big and how should we explain it to the user. For example we used KPI, only 2 KPI almost fills the cellphone screen for the Qlik Sense version in February.
  • Augmented Intelligence
  • Ease of use
  • Associative Engine
  • For Statisctic
  • Machine Learning
  • Better improvement display on mobile
  • Animation
Qlik Sense is good to use if we want to do data discovery supported by associative engine, it is very easy to do. We can know our data better with Qlik.
If we want to monitor our KPI we can do it well in Qlik Sense.

Case for improvement: If we want do further analysis using statistical method, we want [to] do it in one platform, Qlik Sense right now doesn't support this scenario.
Or if we want [to] do the data animation smoothly, Qlik Sense still needs improvement in this area.
James Anderson | TrustRadius Reviewer
Score 10 out of 10
Vetted Review
Verified User
Incentivized
We are using Qlik in a lot of different ways. All the way from monitoring our facilities' fire code standards to how our hospital contracts are performing. The facilities team wants to know how often fire hydrants are serviced to maintain code, so they map out locations and needs of servicing as one simple task. On the hospital and healthcare contracting side it becomes a lot more complicated. We look at how our negotiated contracts with our major payors are performing using multiple sources of data. Qlik handles different sources of data very well.
  • The amazing UI - provides a great experience while trying to organize data using dashboards. Having been a regular user for over a year now, the kind of things you can learn just by yourself on the fly is simply amazing.
  • Qlik Sense provides a quick and efficient way to scan data immediately and helps businesses make better decisions.
  • The dashboards also provide great flexibility with a lot of options. Instead of having to pore over millions of data.
  • Qlik provides way to discover or undercover hidden connections.
  • Qlik has great performance
  • The trial version of the product limits user space to a limited amount.
  • Set analysis is strong but takes time to learn.
  • NPrinting could use some enhancements to make it easier to admin (e.g., .xls spreadsheet for both input & output for all items).

Within the University of Miami healthcare system (UHealth), we wanted to see a high level view of our contracting performance. We are currently are utilizing multiple systems of truth. We utilize the Advisory Board's PIC (Payment Integrity Compass) system to model all of our hospital contracts. For professional services, we use Experian's modeling tool. We wanted to consolidate all of these different inputs of expected payment values into one view or report. There is a need to compare expected contractual values with actual over time. It helps our team get better at predicting the future if we continue to monitor and follow. Our hope was that actual values would materialize from our expected values.

In our own wheel house, we were able to identify easy things where a contract was loaded incorrectly. We also began to see how our processes and other team's processes were negatively affecting the bottom line. We were able to provide tips to other teams to help improve their processes.

Score 9 out of 10
Vetted Review
Verified User
Incentivized
We bought Qlik Sense six years ago and implemented more than 50 apps, for all departments.We currently use it for
  1. Sales
  2. Top management
  3. HR
  4. IT (Qlik logs)
  5. Operations
  6. Finance
  7. Accounting
  8. Purchases
  9. Quality control
  10. R&D
We have approximatively 150 users.
We also use Nprinting with more than 50 reports, distributed on TV screens (via HTML pages) or sent by email.
  • User experience
  • Scalability
  • Easy of use
  • Data catalog
  • Qlik cloud version
  • NPrinting distribution limitations
It's very well suited for our control of production. Every line logs the quantities produced and we can monitor day-to-day the quality of the production, the quantities, and see if we will be able to respond.

It's also very nice to have been able to automate every monthly report for management. They are no longer made by assistants.
April 29, 2021

CEO

Score 8 out of 10
Vetted Review
Verified User
Incentivized
We are using [Qlik Sense] in order to better understand and manage our sell channels, retail wholesale and on line. We are also following our stock in the various warehouses and taking long term purchase decisions with it on a regular base. We have started with only 2 users but now as we grow all managers will use it
  • The data is quick and friendly to read
  • You can present the numbers as you wish for your convenience
  • All company’s channels can be reviewed
  • Add or remove variations
  • Some reports cannot be downloaded to excel
  • Better combination of sales and stock reports for the entire organization
[Qlik Sense] is fantastic for quick data analyze when you want to check the numbers between all companies channels. Stock and sales.
it is also very good for making purchase decisions or to control your stock levels in general. The data is under your hands in seconds and all the information is very clear
Score 10 out of 10
Vetted Review
Verified User
Incentivized
Qlik Sense is used across the whole organization with different maturity degrees of adoption. Within my own department, I don't use it only for monitoring, but also for gaining insight related to server performance. By using Grey-Green-White features in Qlik Sense, I was able to get the usage behavior of all programs running in a server. For example, the peak time, the most used apps, the relationship between time. and certain program usage. I was also able to find the root cause of some problems. For example, finding the root cause of a performance problem case is in lack of memory instead of a lack of CPU.
  • Simplicity and easiness
  • Speed of analysis
  • Green-Gray-White feature
  • The desktop version is longer free. It makes it hard to recommend it to everyone.
  • Lacking interoperability. Only Qlik is able to access QVD Data. Should make a connector to another program.
  • Need a mobile version app with simple authentication (like current the desktop version) which can directly connect to get data in the cloud.
It is perfect for structured data, to create a dashboard, and to get a simple insight into the relationship between dimensions. It is less appropriate for unstructured data, since you will need lots of work to clean/transform the data. It also won't replace R or Python to get more advanced insight using many statistics available in the algorithms.
Score 8 out of 10
Vetted Review
Verified User
Incentivized
In whole organization we use QlikView Server, but for personal use to create more useful visualization we use Qlik Sense and are thinking about purchasing a dual license.
  • Fast development (t2m)
  • Good self-service (only for well created models)
  • Product functionality growth
  • Not very large set of native visual objects
  • Terminated QlikSense Desktop free version
  • Not comfortable for wide visualization tables (QlikView better)
Good for quickly testing working hypotheses and use by small groups. Difficult for big companies with tough data transformation processes.
Score 9 out of 10
Vetted Review
Verified User
Incentivized
It is working well in our organization. We were using Qlik Sense in all major business sectors. As we are one among five of biggest jewelry retailer in the world, Qlik Sense helps us a lot to get the real time sales reports for hedging and others. It helps us to make decisions on time and reduce losses.
  • Definitely the first one is, Qlik Sense is an in-memory tool. It helps the users well on detail analysis like product performance and stock aging, expiry indication, etc...
  • Product reports have millions of line in dataset. Searches are very fast and get any report in detail.
  • Mobile app will be the second strength of Qlik Sense I feel. Because it helps send notifications of Market fluctuation and even interaction between users. None of other products in the market have these features. And the main point is, there is no additional spend for mobile app from the customer side.
  • Qlik Insight bot and AI researches are very brilliant in Qlik Sense. It gives information as per their thoughts. And the trust on the reports/analytics are increasing. There is no Man dependency on reports.
  • Still there are things to improve. But it does not stop Qlik Sense anywhere. I feel there could be more features needed in table formatting, front end designs.
  • Some extensions and buttons are taking more space in mobile apps. If it is more adjustable, then it will give a good feel in mobile also.
  • Qlik Sense partners should have detail and through knowledge about the Qlik back end engine. Because it effects the performance a lot. Also the customers or organizations are evaluating a products by look and feel, information and performance. My suggestion is, Qlik has to restrict or direct Qlik Sense back end development activity for better future. A bad development will be a loss for product.
On analytics side there are many products available in market, but there is only one in memory tool, Qlik Sense. There is no data warehouse need to build a BI solution, only if it is Qlik. I suggest it strongly.
Score 9 out of 10
Vetted Review
Verified User
Incentivized
We are using Qlik Sense from the shop floor persons to top management. It goes from very frequent use in operational matters to nightruns with data extracts and consolidations to management views across the whole company. And it is used in all areas where we need to analyze or handle data. Sales, Purchasing, Inventory, Manufacturing, Finance, Quality, HR. Everywhere.
  • The look and feel for end users are "always" good. You don't need to think about screen size.
  • For 99.9% of our cases I don't need to think about the data size. Qlik handles it very well.
  • With Qlik scripting you can do ANYTHING with your data. For example creating history files of data is very easy. And also linking that into the applications and present it to end users. No more saving Excel files every where.
  • The Qlik Sense management console can definitely be improved. QlikView management console was MUCH better and powerful. Especially regarding task relations.
  • In the Management console there should be better integrations of triggering tasks in for example NPrinting and QlikView.
  • They always refer that it is possible via API, but as business user those things should not require API scripting consulting to get it working.
  • Extensions is VERY useful and gives more power to Qlik Sense. But some of those should be standard built-in features.
  • We are using some extensions from Vizlib that is very powerful.
  • Sync of applications between different distant nodes should be improved. Due to network we have nodes in EU and CN. Those we need to sync manually or via API scripts, Powershell and xcopy scripts depending on what to move.
If you need to dig into some data set with thousands or millions of lines, do it in Qlik Sense. You will immediately find the outliers and odd data. Somehow it will pop up in front of you when start sorting and doing selections. There are no unapproved ways of looking at the data.
I promise, every time I start digging I find "funny data." Doesn't matter what kind of data I look into.
If there is something you do with data "every day" and you do the same every day, add it to Qlik Sense and spend time on the value add instead.
And with data I mean any kind of data. By scripting and automating it you will also secure data handling.
If there is some data you wonder what happens with it, create some history files and do the analyzing.
If it's just some smaller amount of data and you need to do decisions and subjective tweak of data that is hard to adjust to script and logical rules, perhaps not Qlik or any other BI tool is the best. Keep it in Excel.
Otherwise data tweak that is logical you can always add and use in Qlik Sense.
Score 3 out of 10
Vetted Review
Verified User
Incentivized
Qlik sense is being used for our organization to capture demographic data for clients served across all programs, as well as provide outcome data, fidelity data (adherence to our program model), and tracking of strategic initiatives for clients within our flagship program. Additionally, Key Apps and sheets that we use internally have been "templatized" and are being offered as part of the "deep evaluation and learning experience" we provide to other organizations who adopt our flagship model (within their own organization in different states) as part of our Network Affiliate model.
  • Interactive visualizations.
  • Customization to add your own company branding (logo, color schemes, etc.).
  • Allow for multiple cuts or filters of data depending on user needs (region, time frame, client type, etc.).
  • Use Standard SQL so that new staff can build sheets and apps quickly using existing knowledge
  • need to be able to select specific dates for filtering data (i.e., show data for all clients served between 7/1/2019 and 6/30/2020) as this would address the majority of our data requests from contracts and development
  • Provide a "user training" section of the site that allows end-users to have a guided training on how to navigate QilkSense and use Key features like the snapshot tool or how to apply multiple filters to a particular view using the organization's data, not a random dummy data set.
Well suited for departments where teams have actual software development and computer programming formal training. We are an Evaluation team that has technical skills but we are self-taught coders and do not have the knowledge base to set up systems for complex data analysis and visualization.

Training resources seem slim compared to more well-known visualization software (Tableau) which puts our relatively non-technical department at a greater disadvantage in using the product.

We have had a terrible time getting a response from the Qlik team re: expanding licenses and managing the switch from the Desktop to the cloud version of the software. Members of our leadership team and affiliate network members had to wait months before they were granted licenses and access to view their data and dashboards for decision making. This was after multiple calls and emails by our data analyst and our VP of Evaluation and Learning.
Return to navigation